A byproduct of our group’s shared interest in nonprofit organizations, this 8-week project examines relationships the role of nonprofits in Lawrence, KS as part of one of the University of Kansas’ first Introduction to Digital Humanities courses. Using publically-available data from the 2010 US Census to graph demographic information from the City of Lawrence, this project seeks to explore the needs of the Lawrence, KS community and the placement of nonprofits within it.
Our procedure was simple. Using the Douglas County United Way’s volunteering website, we selected a sample of 30 of Lawrence’s nonprofits. Using this directory, the websites of our nonprofits, and the last year of articles from the Lawrence Journal World, we gathered information about the nonprofits’ locations, languages spoken, services, and relationships to one another.
Next, we used the information and GIS locations of the organizations to create an interactive map of our 30 nonprofits with CartoDB, a mapping platform. After plotting the nonprofits with GIS, we added layers of data procured through the City of Lawrence from the 2010 US Census, of neighborhoods that meet federal HUD program guidelines for minority and low income populations. This data helped us foster a greater understanding of environmental justice, and discover what the placement of local nonprofits says about the Lawrence community.
To add more depth to our project, we created a visualization of the network connections between our nonprofits using SylvaDB network analysis, and then Gephi (a similar tool). This visualization helps us understand the functional relationships between nonprofits, and the types of services they offer.
Finally, we have utilized Github pages to create a website, and share this project with you! We hope that our work will challenge you to consider the needs and services that exist within your own community, and consider whether the placement of nonprofits makes a difference. If you are interested in learning more about our work or our team, please email us at lawrencenonprofit@gmail.com.
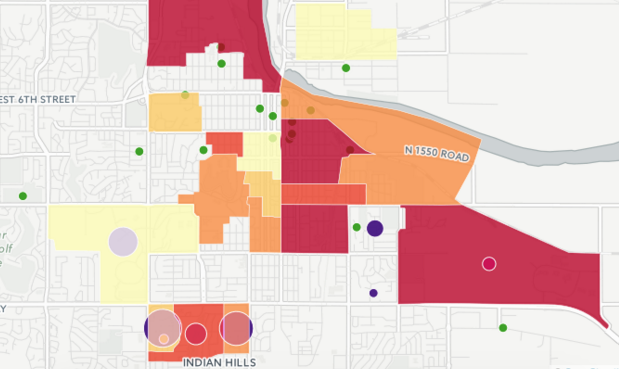
Map of Lawrence Racial and Income Demographics
With this map on the CartoDB platform, we wanted to examine the ways in which Lawrence is (un)served by the local nonprofits by illustrating it geographically. By using information about our sample thirty nonprofits, along with overlay map data from the City of Lawrence for minority and low income populations, were able to uncover a greater understanding of environmental justice, and discover what the placement of local nonprofits says about the Lawrence community.
To understand the data sets on given to us by the City of Lawrence, one must be able to define the terms. We received two maps: one on areas in town which house 1.5 times the average amount of residents from a racial or ethnic minority, and another which displayed the population density of people who meet federal guidelines for low or moderate income. The graph that displays the concentration of ethnic minorities in town uses purple circles with varying diameters to depict differences in density across town. The graph that displays the concentration of people with low to moderate income uses a color scale of reds, oranges, and yellows, with areas that have the highest amount of low to moderate income residents shaded in by red. The guidelines used for this data come from the Federal HUD program (Department of Housing and Urban Development).
The location of the nonprofit organizations is shown in green dots over these maps. Looking at this map, what we see in the map is that some nonprofits are located far away from where these populations actually live, potentially making it harder to serve their purpose.The vast majority of Lawrence nonprofits are located downtown, whereas most of the low income and minority communities are located to the southeast and southwest of Massachusetts St. This is not a mark against the nonprofits; rather, it is suggestive of the long history of racial and economic oppression of the city and state.
A more in-depth study of the intricate matrix of economic, racial, juridical, legislative, and cultural histories of Lawrence should create a more robust understanding of why welfare services look the way they do, both geographically and culturally. Nonprofits are just one manifestation of such matrices of power.
The first things that may come to mind when considering the numerous roles that nonprofits play in a community are: what communities are being serviced; how effective are the nonprofits at implementing their mission statements; or what sorts of resources are available, both to the nonprofits and to their constituents? However, an often overlooked component of the nonprofit apparatus is the ways in which nonprofits interact, network, or otherwise associate with one another. Considering this question can tell us about the diversity, health, and reach of a community’s nonprofit system, all important but perhaps difficult characteristics to gauge from more traditional metrics. Fortuitously, social network analysis allows us to get at some of these issues, albeit requiring a bit of massaging to discern signal from noise in the data.
We therefore combed through pages of Lawrence Journal-World articles, in addition to annual reports, press releases, and Facebook pages to compile a list of what we consider to be accurate connections between organizations. To clarify the methodology a bit, two or more organizations had to be involved in the same event or acknowledge one another financially or socially to be considered connected.
United Way and Lawrence Arts Center Network Clusters
Compiling our data in SylvaDB and exporting it into a file readable by the mapping program Gephi, we quickly came to discern two distinct patterns in our data. First and most striking is that there are two distinct clusters of nonprofits: those that are organized around the United Way and those that orbit the Lawrence Arts Center. This is a notable segmentation of data that would not have been noticeable otherwise due to the centrality of the United Way with almost all of the organizations we studied. The algorithms run by Gephi focus on clustering and the number of similar connections organizations share, meaning that the number of second level connections (i.e. connections of connections shared by organizations) becomes the defining factor for our ‘invisible’ networks. While the quantitative data provided by Gephi is incredibly helpful, qualitative analysis is equally important to bringing meaning to the data. In particular, what this data shows is that the organizations clustering around the United Way focus more on what would be termed essential services (e.g. housing, food, health services, etc.) while those that are centered by the Lawrence Arts Center are more focused on the environment and artistic pursuits (which would make sense on one level).
Four Nonprofit Network Clusters
The second rendering of our data is more difficult to determine, but there are some conclusions to be drawn from it. First, the United Way remains at the center of the universe with three significant clusters organized around it. The first of the clusters (in purple) are those focused on arts and environmental issues, such as the Lawrence Arts Center and the Humane Society. The second group (in cyan) appears to be those focused on family and shelter issues, like the Lawrence Community Shelter and the LDC Housing Authority. The third group (in red) are focused on health issues and include Headquarters, the LDC Health Dept., and Visiting Nurses. Curiously the Lawrence Public Library is included, but we believe that to be because of the partnership with various health groups. Finally, the last cluster is centered on the United Way and includes mostly miscellaneous organizations, but education and religion seem to be the strongest service offered among this cluster.
Both visualizations provide different insights into the social networks of Lawrence’s nonprofits. Rather than an amorphous collection of organizations that each seem to differ from one another, clear patterns emerge when diving into the data, including which organizations are totemic for the community (The LAC and the United Way). This is not to suggest that other organizations are not pillars for the communities they serve; rather, our research shows that these two organizations are best able to cross categorical bounds and connect Lawrence’s nonprofits to one another.
This project only intends to serve as a small exploration into the current state of the nonprofits in Lawrence. Our selection of nonprofits was based on what we thought would be a representative survey of the nonprofits, but by no means is all inclusive. Because of this, our project may overlook some nonprofits in preference of others.
The map we have created does yield to some limitations. With the amount of overlay, the map can seem busy and hard to understand. This might be rectified by showing only one layer at a time, but this then distracts from seeing the whole picture. Additionally, this map does not reflect outreach that various organizations do. For example, Family Promise has a primary location, but also operates out of multiple churches in the area to provide shelter for families in need. This would be difficult to show on the map without getting too confusing--especially on a site that is static--but it is important to show the location of where the services are actually being provided and not just the headquarters.
The network shows current partnerships, but only through data available online. This analysis could be deepened by interviewing nonprofits about their current partnerships. The platform also does not lend itself to an analysis of the history of these relationships, how the nonprofit scene has evolved with the coming and going of certain organizations.
Overall, this project is only the beginning of a much larger inquiry into the nonprofit world of Lawrence, KS.
This project is the result of research conducted by Centennial Clogston, Haley Nus, and Mike Van Esler for Elika Ortega's DH690 course at the University of Kansas.
DISCLAIMER NOTICE
The census data is provided “as is” without warranty or any representation of
accuracy, timeliness or completeness. The burden for determining
accuracy, completeness, timeliness, merchantability and fitness for or the
appropriateness for use rests solely on the requester. The City of
Lawrence makes no warranties, express or implied, as to the use of the
census data. There are no implied warranties of merchantability or fitness for a
particular purpose. The requester acknowledges and accepts the
limitations of the census data, including the fact that the census data is dynamic and is in
a constant state of maintenance, correction and update.